How to monitor Kafka consumer group lag with Client Telemetry
Putting Kafka Client Telemetry to work on Instaclustr Managed Apache Kafka®. Part 1 of 3.
In this series
Part 1: How to monitor Kafka consumer group lag with Client Telemetry (you are here)
Part 2: Identifying when a Kafka share group is falling behind
Part 3: Kafka client fleet visibility and per-producer latency with Client Telemetry
When Instaclustr announced Kafka Client Telemetry earlier this year, the value proposition was clear. Centralized, broker-collected client metrics delivered over OpenTelemetry Protocol (OTLP) to the observability backend you already use. Now lets dig into using it in practice
The use cases in this series are based on the kinds of questions we already hear from Kafka customers, or expect to hear as more customers start adopting Client Telemetry:
- Can I see per-partition consumer group lag with client identity attached?
- Can I tell when a share group is falling behind, given the broker exposes no client-side lag metric for it?
- Can I inventory which client library versions are connected to my cluster?
- Can I separate producer latency by client?
- Can it see authentication failures?
This series works through each of those on Instaclustr Managed Apache Kafka® clusters. Part 1 covers the setup and the first question, per-partition consumer group lag. I used Prometheus and Datadog as backends. Client Telemetry exports plain OTLP, so any OTLP-compatible backend works the same way.
If you’d like to follow along and don’t have a cluster yet, you can sign up for a free 30-day trial at https://console2.instaclustr.com/
What can Client Telemetry do that broker metrics alone cannot?
Broker-side metrics remain essential, and NetApp Instaclustr already exposes a rich set of them. They are mostly cluster and coordinator centric. Client Telemetry (KIP-714) adds a different view. The metrics are pushed by the clients themselves, tagged with client identity such as the client id, group id, group member id and client software version, and they land alongside the rest of your OTLP pipeline.
That client-centric view opens several practical use cases at once. Finer-grained consumer lag, leading indicators for share groups, fleet and version visibility, and per-producer latency breakdowns. It also has boundaries, which Part 3 covers.
What Client Telemetry gives you on Instaclustr Managed Apache Kafka®
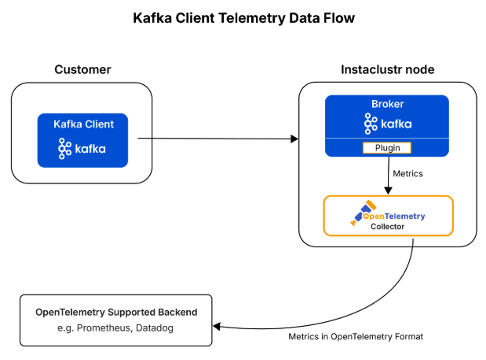
At a high level, the pipeline looks like this:
- Your Kafka clients, whether producers, consumers or share consumers, push client metrics to the brokers.
- An open source broker-side plugin built by Instaclustr forwards those metrics from Kafka to an OpenTelemetry Collector running on the node. The plugin source is available at https://github.com/instaclustr/apache-kafka-client-metrics-reporter-plugin
- The OpenTelemetry Collector pushes the metrics to whichever backend you configured.
- Your backend, Prometheus or Datadog in this series, stores and charts them.
Prerequisites
Before any of this works, a few things need to be in place:
- The cluster must be running in KRaft mode. ZooKeeper-based clusters are not supported for Client Telemetry.
- The cluster must be on Kafka 3.9.1 or later. I used 4.2.1 throughout this series.
- Your applications need a client library that implements the Kafka client metrics protocol from KIP-714. The recommended option is the official Apache Kafka Java client, apache-kafka-java, version 3.7.0 or later.
- You need one telemetry subscription per metric name, since wildcards are not supported, and the managed API enforces a minimum interval of 20 seconds.
These setup steps are documented in the Using Kafka Client Telemetry support documentation.
Enabling Client Telemetry
You can enable this either through the API at cluster creation, or through the Console UI. Please contact support to enable it on an existing cluster.
Using the API
When creating a new cluster, or requesting a change through NetApp support for an existing one, set clientTelemetry in the Kafka cluster create body:
endpointUrl, pointing at your OTLP receiver
enabled: true
- For Prometheus with basic auth,
basicAuthentication
- For Datadog,
authenticationHeaderswith yourdd-api-key
For example, a cluster configured for Prometheus:
POST /cluster-management/v2/resources/applications/kafka/clusters/v3
|
1 2 3 4 5 6 7 8 9 10 11 12 13 14 15 16 17 18 19 20 21 22 23 24 |
{ "name": "my-kafka-telemetry-cluster", "kafkaVersion": "4.2.1", "kraft": [{ "controllerNodeCount": 3 }], "dataCentres": [ { "name": "AWS_VPC_US_EAST_1", "region": "US_EAST_1", "cloudProvider": "AWS_VPC", "network": "10.0.0.0/16", "nodeSize": "KFK-DEV-t4g.small-5", "numberOfNodes": 3 } ], "clientTelemetry": [ { "endpointUrl": "https://<your-prometheus-host>/api/v1/otlp", "enabled": true, "basicAuthentication": [ { "username": "metrics_user", "password": "metrics_password" } ] } ] } |
This Prometheus-configured cluster is what Part 1 and Part 2 are built on. Part 3 uses a separate cluster pointed at Datadog, set up in that article.
One practical gotcha: Set endpointUrl to the OTLP base path only. For Prometheus that means https://<host>/api/v1/otlp, not https://<host>/api/v1/otlp/v1/metrics. The broker exporter appends /v1/metrics itself, so including it in the URL produces a doubled path and silent 404s.
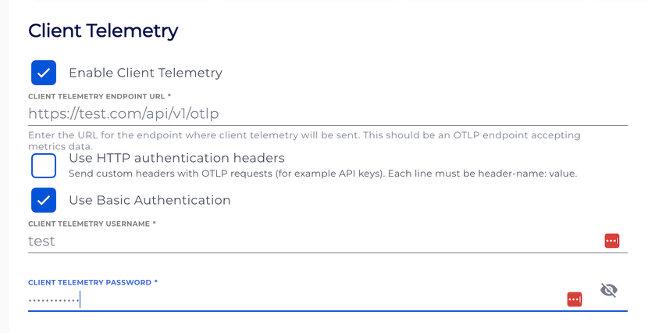
Using the Console
The same setting is exposed as a form under the cluster’s Client Telemetry settings in the Instaclustr Console:
Setting up the exploration: assumptions and caveats
Before the results, here is the scope of what I tested across the whole series.
- I tested on non-production DEV-sized AWS clusters, three brokers on KFK-DEV-t4g.small-5
- Load was generated with the official Kafka CLI shell scripts: kafka-console-producer.sh, kafka-console-consumer.sh and kafka-console-share-consumer.sh.
- Prometheus received OTLP through a tunnel to a local Prometheus 3.x running with
--web.enable-otlp-receiver. Datadog received OTLP at otlp.datadoghq.com with resource attributes promoted to tags.
- Share groups are enabled by default on Kafka 4.2.1 on Instaclustr, so no extra enablement step was needed.
- For share groups, covered in Part 2, the lag story is an approximation built from rates and saturation signals rather than an absolute backlog depth. Treat it as a leading indicator.
Why does per-partition lag matter?
Kafka’s consumer-group coordinator tracks lag as logEndOffset - committedOffset. That’s what kafka-consumer-groups.sh --describe reports as LAG, and it’s what the existing Instaclustr consumerGroupLag monitoring is built from. It tells you the group is behind.
Client Telemetry’s records.lag family measures something different. It reports fetch-position lag from the connected client, roughly highWatermark - fetchPosition, broken out per partition and per group member, carrying client identity, and delivered through the OTLP pipeline. Knowing that distinction up front matters, because the two numbers answer different questions.
Create a telemetry subscription for lag metrics
Subscriptions cover one metric name each. For consumer lag I subscribed to all three members of the lag family:
POST /cluster-management/v2/resources/applications/kafka/client-telemetry-subscriptions
|
1 2 3 4 5 6 |
{ "clusterId": "<your-cluster-id>", "metrics": "org.apache.kafka.consumer.fetch.manager.records.lag.max", "clients": "client_software_name=apache-kafka-java", "interval": 20000 } |
Repeat that for org.apache.kafka.consumer.fetch.manager.records.lag.avg and for the base org.apache.kafka.consumer.fetch.manager.records.lag.
Query lag in Prometheus
Once a slow consumer and a faster producer have been running for at least two subscription intervals, so 40 seconds or more, open Prometheus and run a range query rather than only an instant query.
The OTLP translation gives you these Prometheus metric names:
|
1 2 3 |
org_apache_kafka_consumer_fetch_manager_records_lag org_apache_kafka_consumer_fetch_manager_records_lag_avg org_apache_kafka_consumer_fetch_manager_records_lag_max |
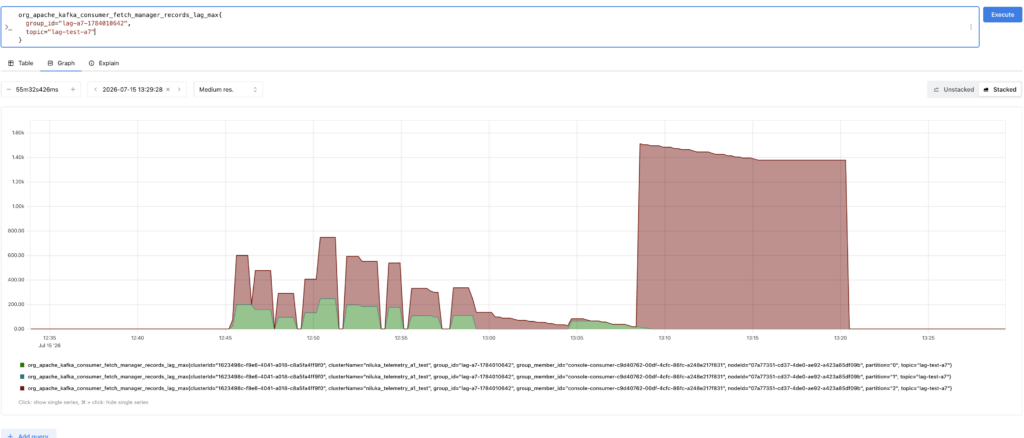
Filter by group and topic, then graph over the load window:
|
1 2 3 4 |
org_apache_kafka_consumer_fetch_manager_records_lag_max{ group_id="<your-group>", topic="<your-topic>" } |
|
1 2 3 4 |
org_apache_kafka_consumer_fetch_manager_records_lag_avg{ group_id="<your-group>", topic="<your-topic>" } |
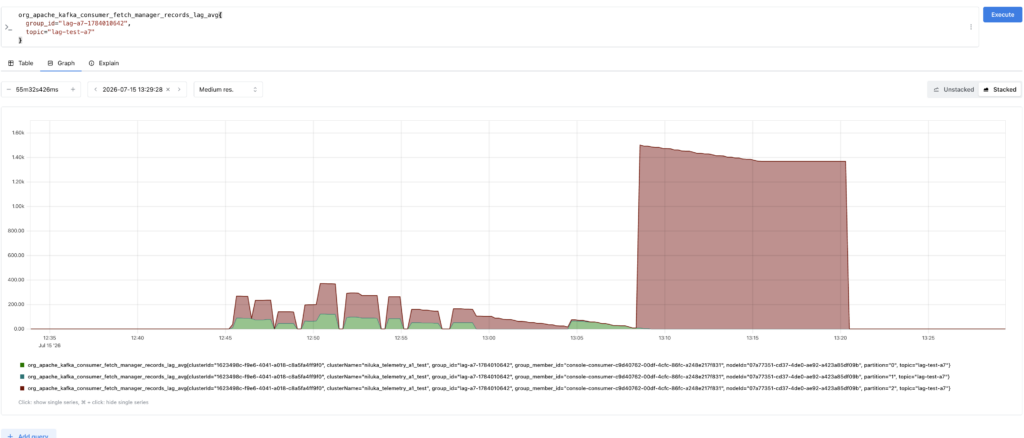
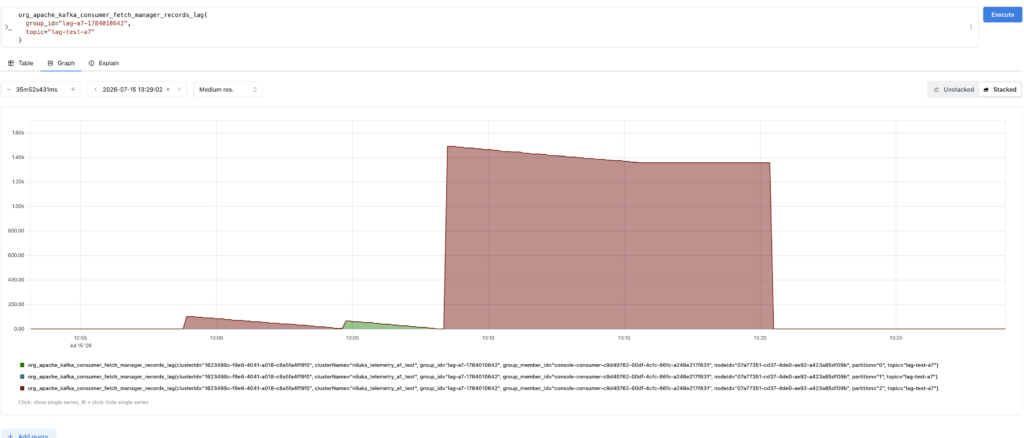
If you promoted the OTLP resource attributes in prometheus.yml, you can also pin a series to a specific broker. The attributes I confirmed on every lag series were group_id, group_member_id, topic, partition, nodeId, clusterId and clusterName.
|
1 2 3 4 5 6 |
org_apache_kafka_consumer_fetch_manager_records_lag{ clusterId="<your-cluster-uuid>", nodeId="<broker-node-uuid>", group_id="<your-group>", topic="<your-topic>" } |
Collapse partitions into a single series for dashboards and alerting
The per-partition queries above are what you want when you’re diagnosing a specific problem. For a dashboard tile or an alert threshold, you usually want one number for the group instead. Two aggregations are worth having.
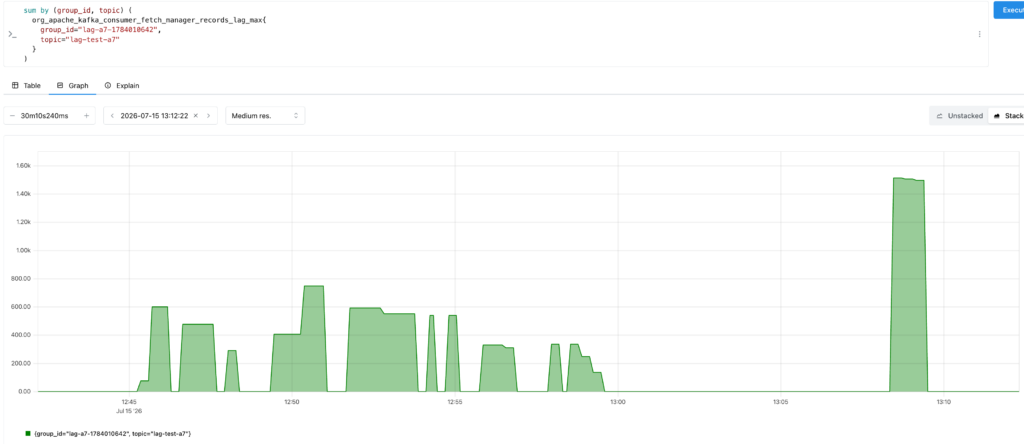
Summing across partitions gives you something close to a group-level backlog view:
|
1 2 3 4 5 6 |
sum by (group_id, topic) ( org_apache_kafka_consumer_fetch_manager_records_lag_max{ group_id="<your-group>", topic="<your-topic>" } ) |
What I found
Per-partition lag through Client Telemetry works. During a 30 minute variable-burst run I cross-checked against kafka-consumer-groups.sh --describe while the consumer stayed connected. At the end of that run the coordinator reported a LAG of 2129 on partition 0 and 4108 on partition 2. Over the same window Prometheus peaked at a records_lag_max of 249 on partition 0 and 1496 on partition 2. Those aren’t the same measurement, so I wouldn’t expect the numbers to line up exactly, but both views put partition 2 well ahead of partition 0 as the one falling behind, which is the part you’d act on. Every series carried the topic, partition, group id and group member id labels.
A few things are worth knowing before you rely on it.
- Prefer
.lag.maxand.lag.avgover the baserecords.laggauge for day-to-day charts. The base gauge can read zero on an instant query even when a backlog exists. Over a range, the avg and max series were the reliable signals. Under a prolonged backlog the base gauge did eventually show non-zero values too.
- Keep the consumer continuously connected. A poll-and-exit console consumer loop doesn’t stay connected long enough to export anything useful.
- Client Telemetry complements the existing platform metric rather than replacing it. Instaclustr’s
consumerGroupLagpolls committed offsets through the Admin API, so it reports total lag per group and keeps working even when no consumer is connected. Client Telemetry reports fetch-position lag from the connected client, per partition and per group member, with client identity attached. Use the committed-offset metric for group-level alerting, and reach for Client Telemetry when you need to know which partition or which instance is behind.
What Part 1 gives you
In Part 1, we now have gone through the following
- Client Telemetry enabled on a managed Kafka cluster, either through the API at creation time or through the Console.
- Subscriptions created for the three consumer lag metrics.
- Per-partition lag charted in Prometheus, cross-checked against the coordinator’s own view of lag.
- Aggregated queries suitable for a dashboard tile or an alert threshold.
- A clear picture of where this sits next to the existing consumerGroupLag metric from our monitoring endpoint
Coming up in Part 2
Classic consumer groups are the easy case, because the broker already tracks committed offsets for them. Share groups are the interesting one. Part 2 introduces share groups, explains why the client side has no lag metric to subscribe to, and builds a practical model for spotting a share consumer that’s falling behind before the backlog becomes a customer-visible problem.
Frequently asked questions
How do I enable Kafka Client Telemetry on Instaclustr?
For new clusters, enable Client Telemetry when you create the cluster by setting the clientTelemetry block and pointing endpointUrl at your OTLP receiver. For existing clusters, contact Instaclustr support to request enablement. Full steps are in the Using Kafka Client Telemetry support documentation.
How do I monitor Kafka consumer group lag with Client Telemetry?
Once Client Telemetry is enabled, create subscriptions for org.apache.kafka.consumer.fetch.manager.records.lag.max and org.apache.kafka.consumer.fetch.manager.records.lag.avg, optionally the base org.apache.kafka.consumer.fetch.manager.records.lag. Then run supported Kafka consumers and chart the translated metrics in your OTLP backend, filtered by group id, topic and partition.
Why do my Prometheus lag charts show zeros on instant queries?
Use the Graph range view and prefer records_lag_max or records_lag_avg. The base records_lag gauge can sit at zero on an instant scrape even when a backlog exists. Range queries over the load window are what made the lag story visible in my tests continously. Keep consumers continuously connected for at least two subscription intervals as well, so 40 seconds or more at the 20 second minimum.
Can I use Client Telemetry with backends other than Prometheus and Datadog?
Yes. The feature exports OTLP. Prometheus and Datadog are the backends Instaclustr supports end to end and the ones used in this series, but they aren’t an exclusive list.
Further reading
- Introducing Kafka Client Telemetry: https://www.instaclustr.com/blog/introducing-kafka-client-telemetry-centralized-client-metrics-for-instaclustr-managed-apache-kafka/
- Using Kafka Client Telemetry (support documentation): https://www.instaclustr.com/support/documentation/kafka/using-kafka/using-kafka-client-telemetry/
- KIP-714, Client metrics and observability: https://cwiki.apache.org/confluence/pages/viewpage.action?pageId=173085915
- Instaclustr Apache Kafka client metrics reporter plugin (open source): https://github.com/instaclustr/apache-kafka-client-metrics-reporter-plugin
About the author
Niluka Weerawarnakula | Senior Software Engineer, Instaclustr by NetApp
I have spent close to five years at Instaclustr, working across several teams before joining Kafka, where I was part of the team that delivered Client Telemetry itself.