Identifying when a Kafka share group is falling behind
October 01, 2026 | By Niluka Weerawarnakula
Putting Kafka Client Telemetry to work on Instaclustr Managed Apache Kafka®. Part 2 of 3.
In this series
Part 1: How to monitor Kafka consumer group lag with Client Telemetry
Part 2: Identifying when a Kafka share group is falling behind (you are here)
Part 3: Kafka client fleet visibility and per-producer latency with Client Telemetry
In Part 1 we enabled Client Telemetry on an Instaclustr Managed Apache Kafka® cluster, created subscriptions for the consumer lag metrics, and charted per-partition consumer group lag in Prometheus. That worked cleanly, because a classic consumer group commits offsets and the broker can always tell you how far behind those commits are.
The question this part answers: My share group consumers are draining a queue, and I want to know from the client side whether they are keeping up, early enough to do something about it.
Share groups make that harder, and they are worth a short introduction before we get to the metrics.
What is a Kafka share group?
Share groups, introduced by KIP-932, bring queue-like semantics to Kafka. In a classic consumer group, each partition is assigned exclusively to one member, and progress is tracked as a committed offset per partition. In a share group, members cooperate on the same partitions. Records are handed out to whichever member is free, acknowledged individually, and redelivered if a member fails to process one.
That’s a much better fit for work-queue workloads, where you care about throughput and completion rather than strict per-partition ordering. It also changes how you reason about the question “how far behind am I?”, because a share consumer doesn’t hold a committed offset in the way a classic consumer does. There’s no single position to subtract from the log end offset.
On Instaclustr, share groups are enabled by default on Kafka 4.2.1, so there’s no extra enablement step.
What you can do from the client side
Client Telemetry comes at the same question from the other end. Rather than reporting how deep the backlog is, it reports how the share consumer itself is behaving. How fast it’s draining work, how hard it’s working while it does so, and how both of those change over time. Those signals turn out to be a good early warning.
The results we got are consistent with how share consumers work. They don’t track an absolute position the way a classic consumer tracks committed offsets, so there’s no client-side equivalent for KIP-714 to push. The absolute depth stays a broker-side number, and the client side gives you direction and stress instead.
The building blocks
These are the metrics I used for this:
org.apache.kafka.producer.record.send.rate, how fast you’re writingorg.apache.kafka.consumer.share.fetch.manager.records.consumed.rate, how fast the share consumer is drainingorg.apache.kafka.consumer.share.poll.idle.ratio.avg, how idle the consumer is inside poll(). Following KIP-517 semantics, a value near 1.0 means idle and waiting, and a value near 0.0 means busy in application codeorg.apache.kafka.consumer.share.time.between.poll.avgorg.apache.kafka.consumer.share.fetch.manager.records.per.request.avg
I also tried subscribing to org.apache.kafka.consumer.share.fetch.manager.records.lag and its .avg and .max variants. The metrics did not appear in Prometheus as share consumers don’t track committed offsets, as mentioned above.
Rate of change: is the backlog growing or shrinking?
If the produce rate consistently exceeds the share-consume rate, the unread backlog is growing, even though you can’t read its absolute depth. That’s the first half of the approximation, and in practice it’s the early signal that a share consumer needs scaling, tuning or investigating, well before the backlog turns into a customer-visible problem.
Subscribe to both rates at the 20 second interval, run a producer deliberately faster than a continuously connected share consumer, then compare them:
|
1 2 3 4 5 6 7 |
# Producer send rate. Per broker node. org_apache_kafka_producer_record_send_rate{nodeId="<nodeID>" } # Share consumer consumed rate org_apache_kafka_consumer_share_fetch_manager_records_consumed_rate{nodeId="<nodeID>" } |
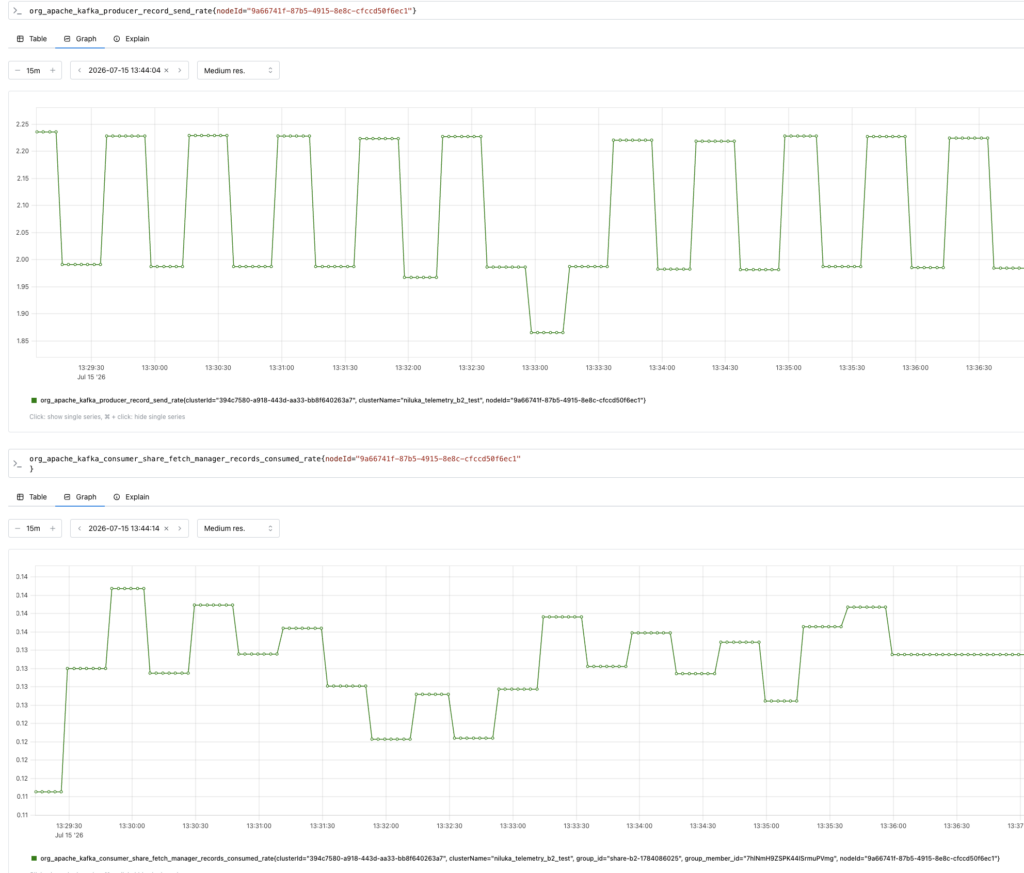
Each broker node independently reported the same producer’s full rate, around 1.9 to 2.2 messages per second. The share consumer sat at roughly 0.10 to 0.14 messages per second. That’s a gap of about 15 to 20 times in the direction I engineered, and it indicates a growing backlog.
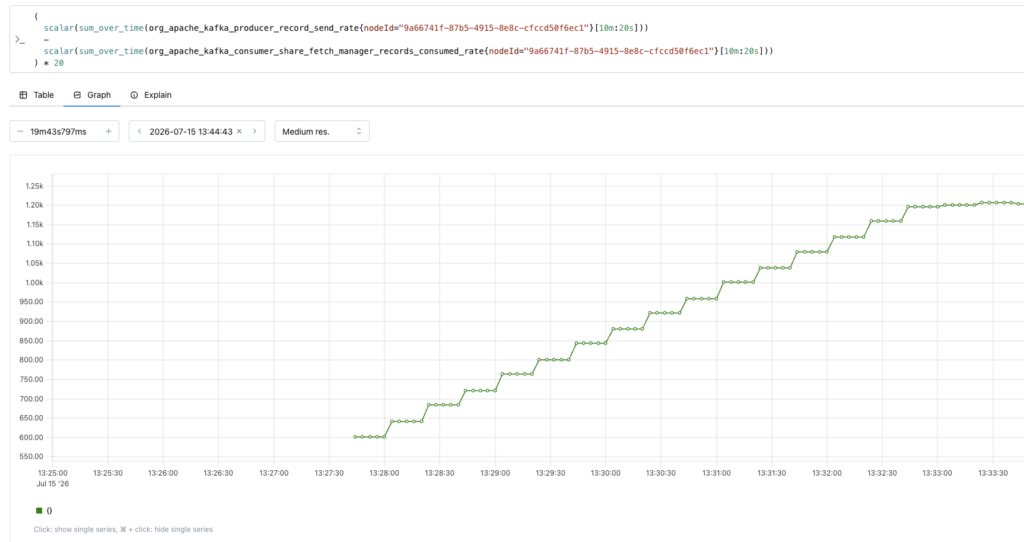
Using the two above we could approximate how many messages were accumulating in the share partition. Subtracting the total consumed from the total produced over the same window, each sampled at the subscription interval, gives a rough message count rather than an instantaneous rate. It’s not a lag counter, but it tells you the direction and rough scale of the backlog without looking at the broker-side metric.
|
1 2 3 4 5 6 |
# Difference between record send rate and records consumed rate ( scalar(sum_over_time(org_apache_kafka_producer_record_send_rate{nodeId="<nodeID>"}[10m:20s])) - scalar(sum_over_time(org_apache_kafka_consumer_share_fetch_manager_records_consumed_rate{nodeId="<nodeID>"}[10m:20s])) ) * 20 |
Saturation: is the share consumer under stress?
Rates tell you the direction. Saturation metrics tell you whether the share consumer is actually under stress while that gap exists. I ran a light phase at roughly 1 message per second, then a heavy burst phase, against the same continuously connected share group.
Three signals moved clearly between the two phases:
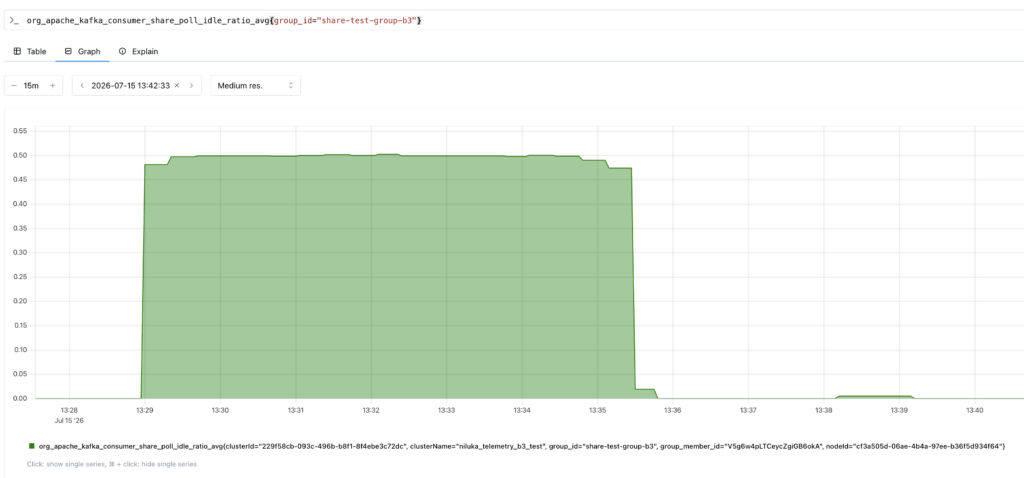
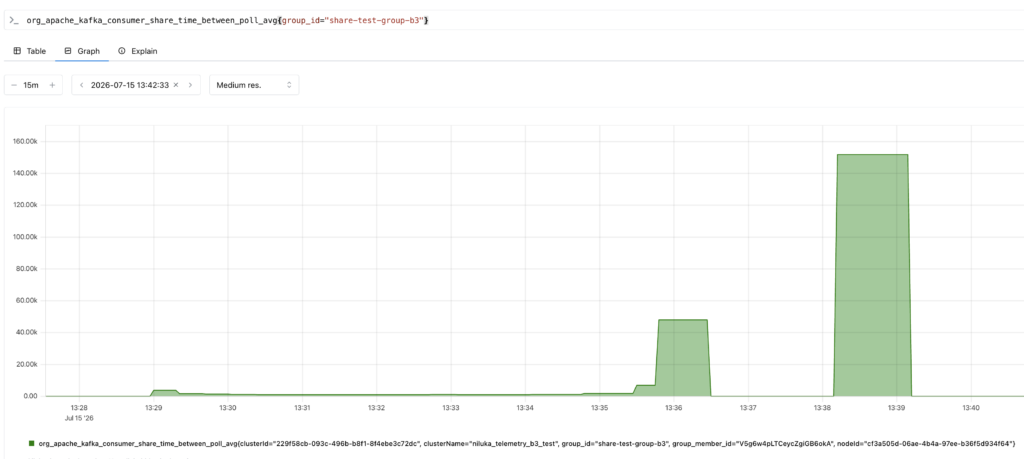
poll.idle.ratio.avgdropped sharply during the heavy phase, falling from ~0.5 toward near-zero levels and showing that the share consumer was spending very little time idle inside poll()time.between.poll.avgwas near zero while the consumer kept up, then spiked to around 120,000 milliseconds(120 seconds) once the backlog built up.fetch.manager.records.per.request.avgwas near zero while the consumer kept up, then climbed to around 240 records per request while draining the backlog.
|
1 2 |
org_apache_kafka_consumer_share_poll_idle_ratio_avg{group_id="<share-group>" } |
|
1 2 |
org_apache_kafka_consumer_share_time_between_poll_avg{group_id="<share-group>" } |
|
1 2 |
org_apache_kafka_consumer_share_fetch_manager_records_per_request_avg{group_id="<share-group>" } |
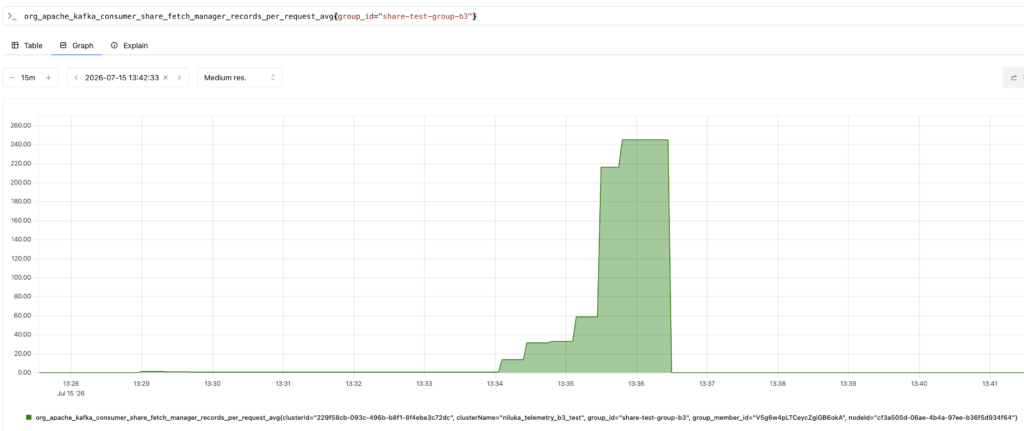
Read together, the three charts tell a consistent story. The idle ratio drops sharply toward near-zero levels, while time between polls and records per request both climb once the heavy phase starts. That combination shows the share consumer spending very little time idle, polling less frequently, and pulling larger batches as it works through the growing backlog.
What this tells you
The model comes down to three checks:
- Confirm that the client-side share lag metric names produce no series while your other share metrics are flowing. Absolute share partition lag is a broker-side number under KIP-1226, not a Client Telemetry one.
- Compare producer record send rate against the share consumer’s records consumed rate. Is the gap growing?
- Check saturation. Idle ratio down, time between polls up, records per request up.
What you get from that is a client-side leading indicator that a share consumer is under stress or falling behind. It is genuinely useful for alerting that a particular client is struggling. What it isn’t is an absolute measurement, so don’t read the rate delta as “exactly N messages behind”. When you need that depth for a specific group, topic and partition, the broker-side KIP-1226 lag is the number to reach for.
What Part 2 gives you
- An understanding of why share groups have no client-side lag metric, and confirmation that subscribing to one silently produces nothing.
- A two-signal model built from produce rate against share consume rate, plus three saturation metrics.
- Working PromQL for each signal, and what the charts look like when a share consumer is falling behind.
Coming up in Part 3
Parts 1 and 2 are both about lag, in Consumer Group and Share Group. Part 3 turns to the clients themselves. Which library versions are connected to your cluster, how to separate one producer’s latency from another in a fleet, exactly which labels arrive on every metric, and one of the things Client Telemetry can’t see.
Frequently asked questions
Does Kafka Client Telemetry support share group lag?
Not directly. There’s no share consumer records.lag metric, or .avg or .max variant, to subscribe to. Absolute share partition lag does exist on Kafka 4.2 brokers through KIP-1226. With Client Telemetry you can still approximate whether a share consumer is falling behind by comparing producer.record.send.rate against share.fetch.manager.records.consumed.rate, then confirming with saturation metrics such as share.poll.idle.ratio.avg and share.time.between.poll.avg.
What is the difference between a Kafka consumer group and a share group?
In a consumer group, each partition is assigned exclusively to one member and progress is tracked as a committed offset. In a share group, members cooperate on the same partitions, records are acknowledged individually, and unprocessed records can be redelivered. Share groups suit work-queue workloads, and they are enabled by default on Kafka 4.2.1 on Instaclustr.
Can I alert on a share consumer falling behind?
Yes, though not as a lag counter. Share groups don’t expose lag counts from the client side. A sustained gap between produce rate and share consume rate, a falling poll idle ratio and rising time between polls are reasonable indicators for an alert condition. Treat it as a signal to investigate rather than as a measurement of how many records are outstanding.
Further reading
- Part 1: How to monitor Kafka consumer group lag with Client Telemetry
- Using Kafka Client Telemetry (support documentation): https://www.instaclustr.com/support/documentation/kafka/using-kafka/using-kafka-client-telemetry/
- Apache Kafka 4.0 share groups, what you need to know about queues for Kafka: https://www.instaclustr.com/blog/apache-kafka-4-0-share-groups-what-you-need-to-know-about-queues-for-kafka/
- KIP-1226, Introducing Share Partition Lag Persistence and Retrieval: https://cwiki.apache.org/confluence/display/KAFKA/KIP-1226%3A+Introducing+Share+Partition+Lag+Persistence+and+Retrieval
- KIP-517, Consumer poll behavior metrics: https://cwiki.apache.org/confluence/display/KAFKA/KIP-517
About the author
Niluka Weerawarnakula | Senior Software Engineer, Instaclustr by NetApp
I have spent close to five years at Instaclustr, working across several teams before joining Kafka, where I was part of the team that delivered Client Telemetry itself.