Kafka client fleet visibility and per-producer latency with Client Telemetry
October 01, 2026 | By Niluka Weerawarnakula
Putting Kafka Client Telemetry to work on Instaclustr Managed Apache Kafka®. Part 3 of 3.
In this series
Part 1: How to monitor Kafka consumer group lag with Client Telemetry
Part 2: Identifying when a Kafka share group is falling behind
Part 3: Kafka client fleet visibility and per-producer latency with Client Telemetry (you are here)
Part 1 set up Client Telemetry and used it to chart per-partition consumer group lag in Prometheus. Part 2 built a client-side model for spotting a share group consumer that’s falling behind.
The question this part answers: what can I learn about the clients themselves? Which library versions are connected, which producer is slowest, how do I narrow a busy fleet down to one process, and where does the feature stop?
For this part I used a separate cluster pointed at Datadog rather than Prometheus, which Instaclustr also supports as a backend.
Setting up a Datadog-bound cluster
A Datadog-bound cluster needs its OTLP endpoint pointed at Datadog and an API key supplied as a request header. It also needs a second header to promote OTLP resource attributes into Datadog tags, which is what makes clientsoftwareversion, clientid and group_id queryable. Both headers go in the clientTelemetry block of the cluster create body.
POST /cluster-management/v2/resources/applications/kafka/clusters/v3
|
1 2 3 4 5 6 7 8 9 10 11 12 13 14 15 16 17 18 19 20 21 22 23 |
{ "name": "my-kafka-datadog-cluster", "kafkaVersion": "4.2.1", "kraft": [{ "controllerNodeCount": 3 }], "dataCentres": [ { "name": "AWS_VPC_US_EAST_1", "region": "US_EAST_1", "cloudProvider": "AWS_VPC", "network": "10.0.0.0/16", "nodeSize": "KFK-DEV-t4g.small-5", "numberOfNodes": 3 }], "clientTelemetry": [ { "endpointUrl": "https://otlp.datadoghq.com", "enabled": true, "authenticationHeaders": [ { "key": "dd-api-key", "value": "<your-datadog-api-key>" }, { "key": "dd-otel-metric-config", "value": "{\"resource_attributes_as_tags\": true}" } ] }] } |
Budget time for tag indexing. The tag catalog can take some time to finish indexing even once the correct header is in place. The metrics themselves become queryable almost immediately, but the tag facets in the Metrics Explorer can look empty until the indexing has finished.
Client fleet and version visibility
This one worked cleanly. Two console consumers built from different Kafka client versions, 3.9.1 and 4.1.2, each running in its own group, showed up as distinct series once broken down by client software version and client id.
In the Datadog Metrics Explorer:
|
1 |
avg:org.apache.kafka.consumer.connection.count{*} by {clientsoftwareversion,clientid,group_id} |
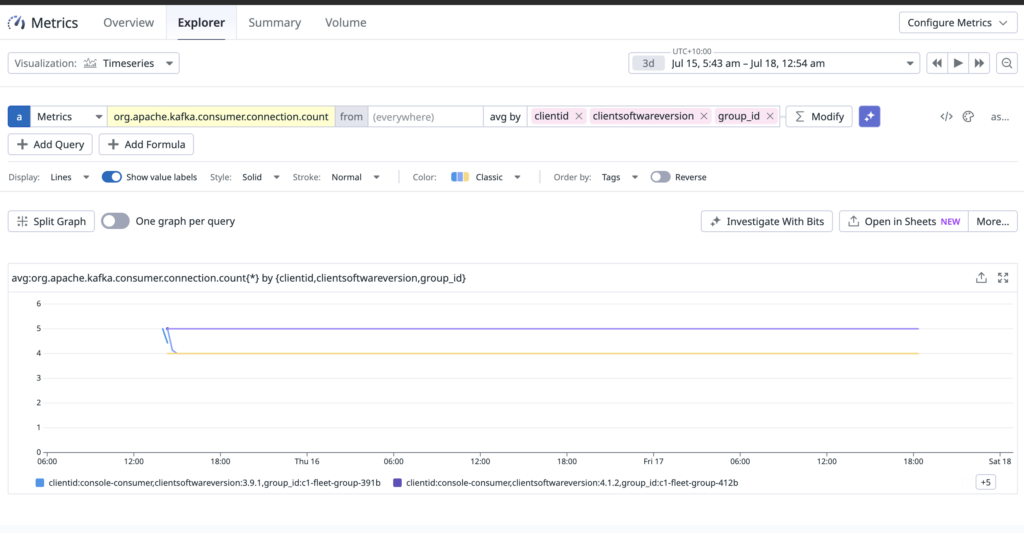
That’s a genuinely useful inventory. If you’re planning a client library upgrade, or trying to work out whether an old version is still connecting to a cluster, this answers the question directly and without needing anything installed on the client hosts.
What labels arrive on every metric
Every metric that reaches your backend carries a set of labels you can filter and group by. They come from two places.
From the client and the broker plugin:
| Label | What it identifies |
| clientid | The client.id the application set on its producer or consumer. Customer-chosen, so it may be the same across multiple instances. |
| clientsoftwarename | The client library, for example apache-kafka-java. |
| clientsoftwareversion | The library version, for example 4.1.2. This is the one the fleet visibility example above uses. |
| group_id | The consumer group or share group the client belongs to. Present on consumer and share consumer metrics. |
| group_member_id | The individual member within that group, which is how you separate one instance from another. |
Added by Instaclustr:
| Label | What it identifies |
| nodeId | The broker node that emitted the client telemetry data. |
| clusterId | The UUID Instaclustr assigns to the cluster at creation time. |
| clusterName | The name you gave the cluster when you created it. |
On lag metrics specifically you also get topic and partition, which is what made the per-partition charts in Part 1 possible. Producer and consumer metrics aren’t distinguished by a label. You tell them apart from the metric name itself, since producer metrics begin with org.apache.kafka.producer and consumer metrics with org.apache.kafka.consumer.
Per-producer latency visibility
The mechanism works. producer.request.latency.avg is queryable by clientid in Datadog, so you can separate individual producers within a fleet. Here is what that looks like with four producer processes, each with its own client id, tracked independently against the same topic:
|
1 |
avg:org.apache.kafka.producer.request.latency.avg{*} by {clientid} |
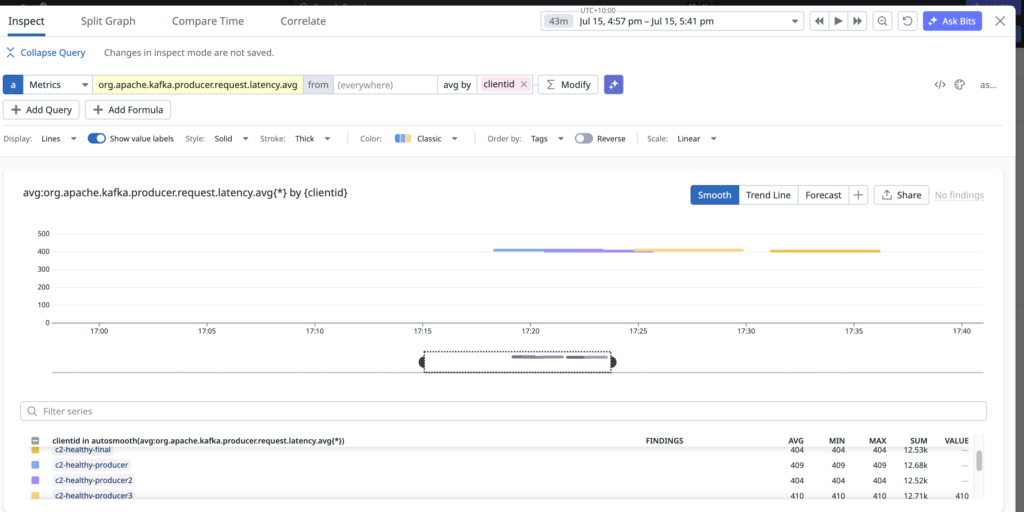
All four landed in a consistent band of roughly 403 to 410 milliseconds. Each producer is independently trackable by its client id, which is exactly what you would use to spot one producer in a larger fleet running measurably hotter than the rest.
Knowing the boundary: authentication failures
Kafka clients do expose authentication-related metrics, including failed.authentication.rate, so I tested whether a producer with bad SASL credentials would show up there while a second producer with valid credentials kept running normally.
The valid producer appeared in Client Telemetry as expected. The producer with bad credentials never appeared at all, not in failed.authentication.rate and not in any other client-side series, even though it was logging SaslAuthenticationException locally on every retry.
The reason is structural rather than a gap in the implementation. KIP-714 telemetry is pushed by the client over the same authenticated session it uses for normal traffic. A client that never completes authentication never receives a telemetry subscription and never gets the chance to report anything, including its own failure. For authentication problems, broker-side logs, broker metrics and platform monitoring are the right places to look, and Client Telemetry is the wrong tool by design.
What Part 3 gives you
- A Datadog-bound cluster configured through the API, including the header that promotes OTLP resource attributes into queryable tags.
- A one-query inventory of which client library versions are connected to your cluster.
- A clear picture of which labels arrive on every metric.
- Per-producer latency separated by client id, which is what you would use to find one hot producer in a fleet.
- A documented boundary on authentication failures, so you know when to reach for broker-side tooling instead.
Conclusion: what the series covered
Across the three parts, here is what Client Telemetry delivered.
What worked:
- Per-partition consumer group lag through
lag.maxand.avg, and the base gauge under a sustained backlog, with rich client and cluster labels in Prometheus. - A practical falling-behind model for share groups, built from produce rate against consume rate and confirmed with saturation metrics, given that clients don’t expose a share consumer lag metric.
- Client fleet and version visibility in Datadog through
connection.countbroken down byclientsoftwareversion. - Per-producer latency visibility in Datadog through
request.latency.avgbroken down byclientid.
What I would not claim yet:
- A Client Telemetry equivalent of share partition lag. It is unavailable by design, so use the broker-side number for absolute depth and the client-side rates and saturation signals as leading indicators.
- Per-client authentication failure detection, as clients need to be authenticated in order for the metrics to be sent.
Frequently asked questions
How do I see which Kafka client versions are connected to my cluster?
Subscribe to a metric every client reports, such as org.apache.kafka.consumer.connection.count, then group the series by client software version in your backend. In Datadog with resource attributes promoted to tags, that’s a single query grouped by clientsoftwareversion.
Can Client Telemetry detect Kafka authentication failures?
No, and this is by design rather than a gap. KIP-714 telemetry is pushed by the client over an already-authenticated session, so a client that never authenticates never gets the chance to report anything. Use broker-side logs, broker metrics or platform monitoring for authentication problems.
Can I tell producer metrics from consumer metrics?
Yes, from the metric name rather than from a label. Producer metrics begin with org.apache.kafka.producer and consumer metrics begin with org.apache.kafka.consumer, with share consumer metrics under org.apache.kafka.consumer.share.
Further reading
- Part 1: How to monitor Kafka consumer group lag with Client Telemetry
- Part 2: Identifying when a Kafka share group is falling behind
- Introducing Kafka Client Telemetry: https://www.instaclustr.com/blog/introducing-kafka-client-telemetry-centralized-client-metrics-for-instaclustr-managed-apache-kafka/
- Using Kafka Client Telemetry (support documentation): https://www.instaclustr.com/support/documentation/kafka/using-kafka/using-kafka-client-telemetry/
- KIP-714, Client metrics and observability: https://cwiki.apache.org/confluence/pages/viewpage.action?pageId=173085915
- Instaclustr Apache Kafka client metrics reporter plugin (open source): https://github.com/instaclustr/apache-kafka-client-metrics-reporter-plugin
About the author
Niluka Weerawarnakula | Senior Software Engineer, Instaclustr by NetApp
I have spent close to five years at Instaclustr, working across several teams before joining Kafka, where I was part of the team that delivered Client Telemetry itself.