Apache Kafka Client Telemetry
Apache Kafka Client Telemetry provides a standardized way to collect performance and behavioral metrics directly from Kafka clients. Producers, consumers, administration clients, and supported Kafka applications can report selected metrics to the Kafka cluster. NetApp Instaclustr then exports those metrics to a customer-configured OpenTelemetry Protocol (OTLP) endpoint.
Client Telemetry complements broker and cluster monitoring by showing what connected clients are experiencing. It can help identify slow producers, lagging consumers, outdated client libraries, request latency, retry behavior, and other client-specific conditions that broker-level metrics alone cannot explain.
Background Knowledge
Kafka brokers expose detailed information about the health and behavior of the cluster. However, many performance problems originate in the applications that produce and consume data. Before Kafka Improvement Proposal (KIP) 714, collecting those client metrics centrally usually required every application team to configure and operate its own monitoring integration.
KIP-714 added a telemetry protocol to Apache Kafka. It allows compatible clients to:
- Discover whether a broker accepts Client Telemetry.
- Retrieve a telemetry subscription from the cluster.
- Collect only the metrics requested by that subscription.
- Push the selected metrics back to a connected broker at the configured interval.
KIP-1000 adds an administrative API for listing configured client-metrics resources. KIP-1076 extends the model to metrics from client applications such as Kafka Streams.
On the NetApp Instaclustr Managed Platform, Client Telemetry sends selected metrics through a broker-side reporter plugin and an OpenTelemetry Collector to the observability endpoint configured for the cluster.
Below is a diagram of this flow,
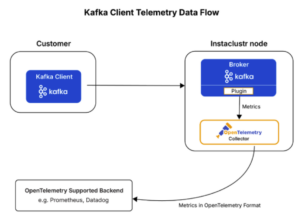
Key benefits include:
- Centralized client visibility: Collect metrics from matching clients without installing a separate monitoring agent on every client host.
- Client-level diagnosis: Filter and group metrics by attributes such as client ID, client software name, client software version, consumer group, topic, and partition where applicable.
- Controlled collection: Choose the exact clients, metrics, and reporting interval through subscriptions.
- OpenTelemetry integration: Export metrics using OTLP to supported observability backends such as Prometheus and Datadog.
How It Works
Client Telemetry uses two related flows:
- Kafka telemetry flow: Client to broker.
- OTLP export flow: Broker reporter plugin to the local OpenTelemetry Collector, then from the Collector to the configured observability endpoint.
The end-to-end path is:
- A compatible client connects and authenticates to the Kafka cluster as normal.
- The client identifies that a broker supports Client Telemetry.
- The client sends a GetTelemetrySubscriptions request. The broker returns the matching metric names, reporting interval, accepted compression types, and maximum telemetry payload size.
- The client collects those metrics and sends them in a PushTelemetry request at the configured interval.
- The broker passes the telemetry payload to the NetApp Instaclustr Open Source reporter plugin.
- The plugin enriches the metrics with cluster and client context, then forwards them to an OpenTelemetry Collector running on the broker node.
- The Collector exports the metrics to the customer-configured OTLP endpoint.
Relationship to Normal Produce and Consume Traffic
Client Telemetry does not embed metrics in produce or fetch requests. It uses dedicated GetTelemetrySubscriptions and PushTelemetry Kafka protocol requests.
The client normally sends these telemetry requests over a broker connection that it already uses. It does not create a separate producer, open a dedicated telemetry connection, or send the metrics as records to a Kafka topic. The telemetry payload is therefore not appended to a partition log, retained with application data, or replicated between brokers.
Telemetry is scheduled by time rather than by message volume. A PushTelemetry request is sent when the subscription interval expires, independently of the number of produce or consume requests completed during that interval. There is no one-to-one relationship between an application record and a telemetry push.
The client prefers to keep sending telemetry to the same connected broker until that connection becomes unavailable. The broker receiving the telemetry request does not have to be the leader for the topics the application is using.
Although telemetry is a separate request type, it shares some resources with normal traffic:
- The client reuses its Kafka networking threads and an existing authenticated broker connection.
- The broker must receive and process the telemetry request.
- Standard request quotas and telemetry-specific interval limits protect the broker from clients that send excessive requests.
- Metric serialization, broker-side processing, and export use central processing unit (CPU), memory, and network capacity.
For this reason, Client Telemetry subscriptions should target only the metrics needed for a defined use case. The Using Kafka Client Telemetry guide describes the supported subscription controls and current reporting interval.
Subscriptions Control What Clients Send
Enabling Client Telemetry on a cluster establishes the export destination, but it does not cause every client to send every available metric. At least one matching subscription is required.
A subscription defines:
- Clients: Which connected clients match the subscription, based on attributes such as client ID, client instance ID, software name, software version, source address, or source port.
- Metric: The exact metric the matching clients should report.
- Interval: How frequently the matching clients should push the metric.
Only compatible clients that match an active subscription emit the requested telemetry. If a subscription changes, clients retrieve the updated configuration from the cluster. If there is no matching metric subscription, the client does not send metric values.
Delivery to the Observability Endpoint
The broker-side reporter plugin receives the telemetry payload and adds context that helps identify where it came from. The plugin sends the enriched metrics to the OpenTelemetry Collector on the same node. The Collector then exports the data to the endpoint configured for the cluster.
The external observability endpoint is not in the Kafka produce, replication, or fetch path. An endpoint outage can interrupt telemetry export, but it does not turn the metrics into Kafka records or change how application records are stored.
Requirements and Limitations
The current NetApp Instaclustr implementation has the following requirements and limitations:
- Kafka clients must use a client library that implements KIP-714. The official Apache Kafka Java client supports the protocol from version 3.7.0.
- The Kafka cluster must use Kafka Raft (KRaft) metadata mode.
- The cluster must run a supported Apache Kafka version. See Using Kafka Client Telemetry for the current minimum version and network compatibility.
- A Client Telemetry export configuration and at least one matching metric subscription are required.
- The client must successfully authenticate to Kafka before it can retrieve a subscription or send telemetry.
- Disconnected or inactive clients cannot push current metrics.
Some noteworthy behavioral aspects of Client Telemetry to be aware of:
- Client Telemetry should not replace broker-side monitoring for conditions that must remain visible when no client is connected.
- The number of emitted metrics grows with the number of matching clients, subscribed metrics, and reporting frequency. Broad subscription sets can add measurable broker and network load.
Frequently Asked Questions
Q: Are telemetry metrics sent as part of normal produce or consume requests?
A: No. Clients use dedicated GetTelemetrySubscriptions and PushTelemetry protocol requests. These requests are interleaved with other Kafka protocol traffic over an existing broker connection, but they are separate from Produce and Fetch.
Q: Does Client Telemetry open a separate connection to the Kafka cluster?
A: Normally, no. A client prefers an existing authenticated broker connection and continues using the same broker for telemetry until the connection becomes unavailable. This avoids adding another connection for every producer or consumer.
Q: Does the client send telemetry after every message or batch?
A: No. Telemetry is pushed on the subscription interval. The number of application records produced or consumed during that period does not directly determine how often telemetry is sent.
Q: Are telemetry metrics written to an internal Kafka topic?
A: No. The telemetry payload is passed to the broker-side reporter plugin and then to the OpenTelemetry Collector. It is not appended to a topic, replicated as Kafka log data, or retained according to topic-retention settings.
Q: Does Client Telemetry affect normal Kafka traffic?
A: It does not change the semantics of producing or consuming records. However, collecting, serializing, receiving, and exporting telemetry uses client and broker resources. Subscriptions covering many clients or metrics, or using short intervals, can add CPU and network load. Start with the metrics required for a specific use case and monitor cluster capacity as subscriptions grow.
Q: What happens if a client pushes telemetry more often than its subscription allows?
A: The broker applies a telemetry-specific interval limit in addition to its standard request quotas. A push that arrives before the configured interval has elapsed can be rejected with a throttling error.
Q: Which broker receives a client’s telemetry?
A: The client can send telemetry to a connected broker that advertises support for the telemetry APIs. It normally keeps using the same broker connection until that connection fails. The receiving broker forwards the payload through its local reporter plugin and OpenTelemetry Collector.
Q: What happens if the client cannot authenticate?
A: The client cannot retrieve a telemetry subscription or push metrics. This means Client Telemetry cannot report a client’s own failed authentication attempt when the client never establishes an authenticated session. Use broker logs, broker metrics, and platform monitoring for authentication failures.
Q: What happens when a client disconnects or shuts down?
A: A supported client can make a final telemetry push during an orderly shutdown. After the client disconnects, it cannot send further metrics. Unexpectedly terminated or inactive clients can therefore disappear from the telemetry stream.
Q: Does Client Telemetry replace consumer-lag monitoring?
A: No. Client Telemetry provides client-side metrics with client identity and, for supported metrics, topic and partition context. Broker-side consumer-group monitoring remains the authoritative option for committed-offset lag. Use the two views together.
Q: Can every Kafka client send the same telemetry metrics?
A: No. The metrics available depend on the client library and version. The official Apache Kafka Java client provides broad support, while other client implementations may support a different subset or may not implement KIP-714.
Q: Where do the exported metrics go?
A: The OpenTelemetry Collector sends them to the OTLP endpoint configured for the cluster. Prometheus and Datadog are supported end-to-end destinations. See Using Kafka Client Telemetry for current configuration details.
Q: How should I choose a reporting interval?
A: Balance diagnostic resolution against processing and network cost. Shorter intervals provide more frequent data but generate more requests and exported metrics. Start with a longer interval, e.g. 5 minutes, subscribe only to the exact metrics required, and reduce the interval only when the use case justifies the additional load. The default value described in Using Kafka Client Telemetry is 20 seconds.
For configuration instructions, prerequisites, and current supported environments, see Using Kafka Client Telemetry.
For practical examples, see:
Please contact [email protected] for further assistance.