Instaclustr Monitoring with Prometheus
The Instaclustr Prometheus Monitoring API allows users to retrieve metrics in Prometheus format for clusters running in the Instaclustr Managed Platform. The Prometheus API also implements Prometheus service discovery mechanisms to provide a discovery endpoint that can be used to discover newly created clusters and node changes to existing clusters without requiring Prometheus configs to be updated. Metrics scraped from Prometheus can then be integrated with visualization and alerting tools such as Grafana for a complete monitoring/alerting solution. The Instaclustr Cluster Prometheus Monitoring API can be used with any tool that supports the ingestion of Prometheus format metrics. The following steps walk through how to configure and use the API with Prometheus and Grafana.
Configure Prometheus
If you haven’t already, pull the Prometheus docker image from https://hub.docker.com/r/prom/prometheus/.
Run Prometheus with:
|
1 2 3 4 |
docker run \ -p 9090:9090 \ -v /path/to/prometheus.yml:/etc/prometheus/prometheus.yml \ prom/prometheus |
You will need to configure prometheus.yml to discover your clusters. You can find example prometheus.yml configs for discovering your clusters by going to the Connection Info tab under any of your clusters and then selecting the Prometheus connection example. Here is an example prometheus.yml file:
|
1 2 3 4 5 6 7 8 9 10 11 12 13 14 15 16 17 18 |
global: scrape_interval: 20s evaluation_interval: 20s scrape_configs: - job_name: instaclustr_prometheus scheme: https http_sd_configs: - url: https://<your_account_id>.prometheus.monitoring.instaclustr.com/discovery/v1/<your_cluster_id> basic_auth: #get from account settings page username: <your_user_name> password: <your_prometheus_api_key> metrics_path: 'metrics/v2/query' basic_auth: #get from account settings page username: <your_user_name> password: <your_prometheus_api_key> |
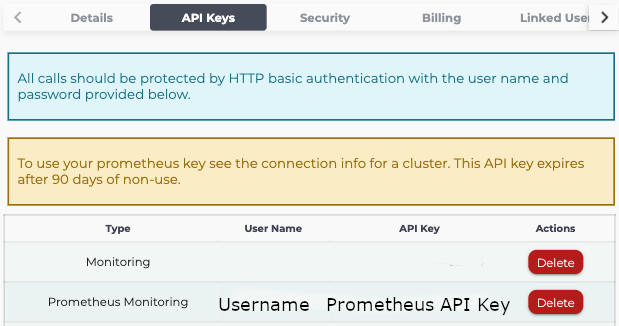
Replace the fields surrounded by angle brackets such as <your_user_name> etc. Your username and Prometheus monitoring API key can be created in the Instaclustr console, in the Account tab. Make sure to copy your API key as it will only be displayed once.
To specify the clusters you would like Prometheus to scrape metrics from, replace <your-cluster-id> to include the cluster you would like to scrape. You can add additional URLs to http_sd_configs to scrape additional clusters. Alternatively, you can specify https://<your-account-id>.prometheus.monitoring.instaclustr.com/discovery/v1/ as a URL for http_sd_configs to scrape an entire Instaclustr account.
| Set a scrape interval of 20 seconds or greater. This aligns with the refresh rate of our monitoring system and any lower an unnecessary use of resources. |
|---|
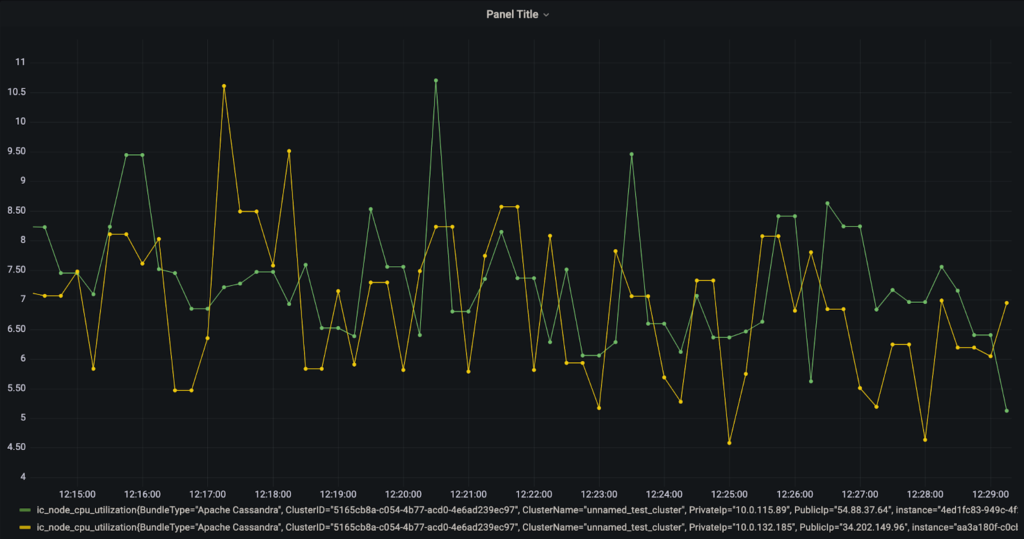
We collect general node metrics that are useful for monitoring general cluster health information such as CPU usage, disk usage, and memory usage on nodes; “ic_node_disk_utilization”, “ic_node_cpu_utilization” and “ic_node_memavailable”. Application-specific metrics, such as table metrics for Cassandra and Topic metrics for Kafka are also available. For available metrics, please refer to: https://instaclustr.redoc.ly/Current/tag/Monitoring-API. All metrics are labeled with the node id they are associated with and are tagged by their cluster id, public IP, and private IP for easy identification.
Viewing Metrics with Grafana
Grafana has inbuilt support for Prometheus and is the recommended visualization tool for Prometheus metrics. If you haven’t already, follow the instructions at https://grafana.com/docs/grafana/latest/installation/ to install Grafana.
To integrate Prometheus monitoring with Grafana first go to your Grafana data sources tab in Configuration (https://localhost:3000/datasources) and add a new data source targeting the URL of the Prometheus scraper you set up above. Then create a new dashboard and specify Prometheus as the data source and we can start visualizing our metrics. In the query tab select a metric from the “Metrics Browser” dropdown box and the labels and label values you want to filter on. 
As you can see above in Grafana we can specify the Cluster ID, Node ID, Private or Public IP etc. to choose what nodes to monitor. Cluster tags created through the Instaclustr console can also be exposed as labels for easy reference. Cluster tags can be created by clicking the top-right gear and selecting the Cluster Resources menu and then selecting the Tags tab. Note that Prometheus doesn’t support labels with special characters so special characters in labels are replaced with “_”. Other metric labels such as metric type and schema-related labels such as the table for Cassandra metrics are also available. Once the desired metric has been selected click “Use query” to visualize.